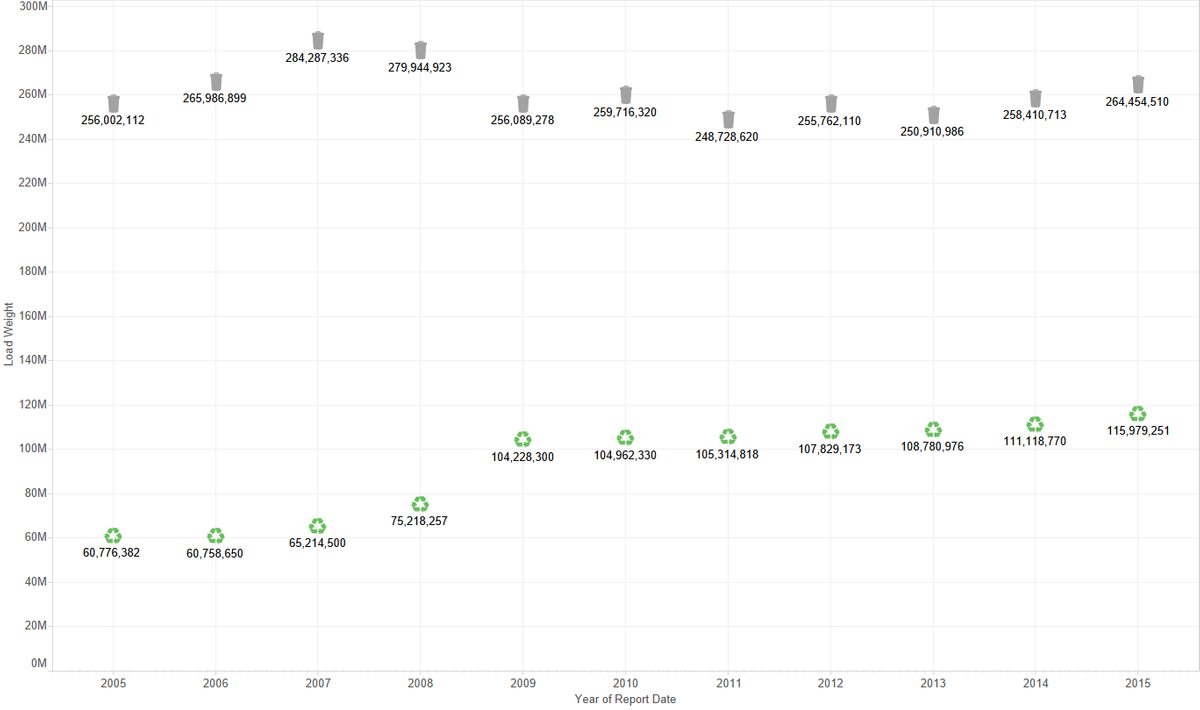
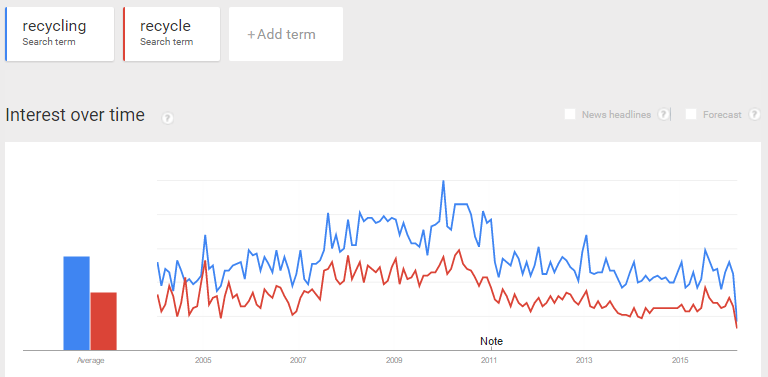
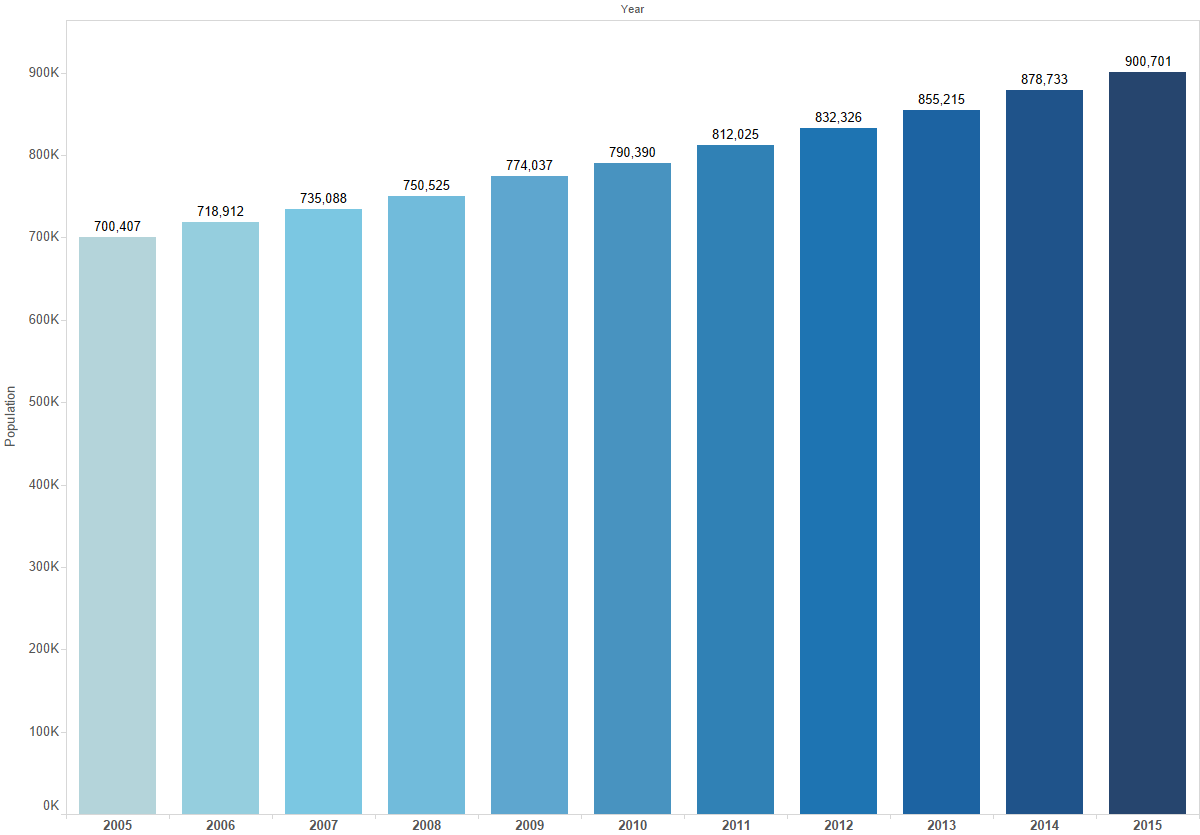
The City of Austin website houses daily waste collection data dating all the way back to the end of 2004. With the city growing at such a rapid pace and the effort to be green at the front of our minds, we were curious what the data could tell us about these efforts. Do newcomers share Austin’s environmental vision? How has the amount of garbage and recycling changed over the past ten years? These are a couple of the questions we will be answering with data visualizations as we celebrate Earth Day.
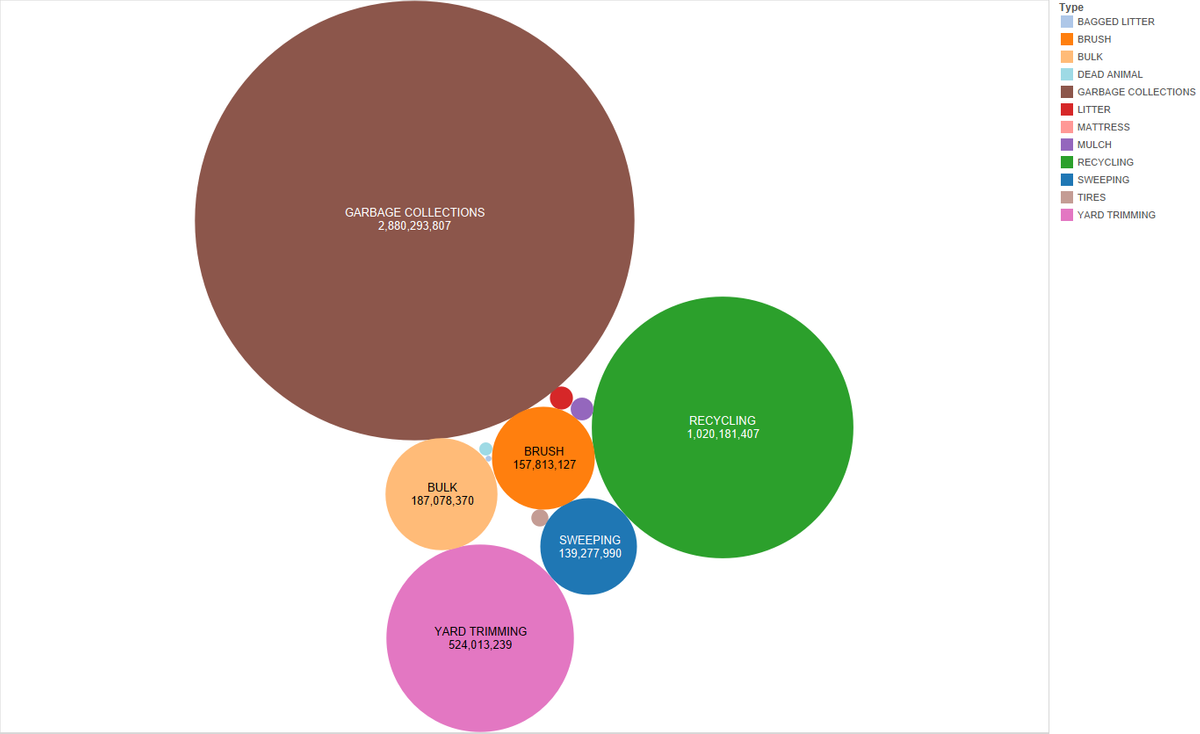
Let’s start by looking at the past ten years as a whole. The waste is split into categories such as garbage collection, recycling, tires, yard trimmings, etc. Please note that we will be looking at recycling as a whole rather than splitting by stream to simplify the view.


