
Blog
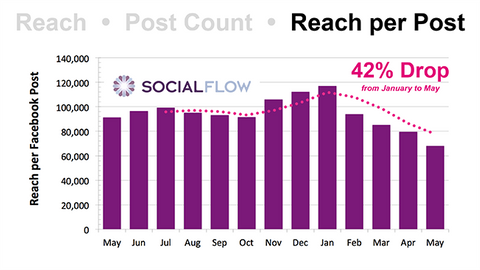
Study Finds Organic Facebook Reach Down 42%
Julia Schulze
A new report from social media analytics company Social Flow shows that organic reach on Facebook has dropped 42% since January. Many businesses that have traditionally relied on reaching customers organically through Facebook are now having to rethink their strategy. The idea that Facebook reach is decreasing is not news to most of us working in the social media field. However, it is surprising just how drastic the decrease is. Social Flow came to this conclusion after aggregating the reach of more than 3,000 Facebook pages, showing that this is a change on the Facebook side, not just the issue with the audience of a few pages. We’ve been seeing Facebook push users to boost posts for a while now but it is clear that if pages want to appear in the newsfeed of their fans they are not going to get many impressions for free.
more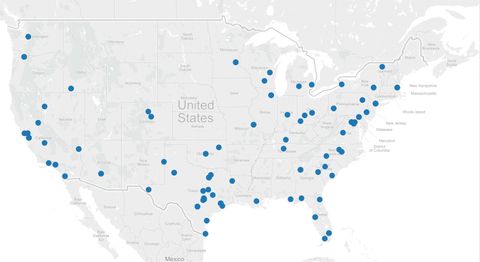
The Aftermath of #Prop1: What We Can Learn from the Twitter Data
Julia Schulze
After Austin’s Proposition 1 was defeated in a close 56% to 44% vote in early May, showing that voters wanted to keep the city’s required fingerprint background checks, we were curious to see how people were discussing the results on social media. People for and against the proposition were active on Twitter leading up to the vote in an effort to educate voters on the situation. But how were Twitter users reacting after such a close vote? What clues could we find to help predict what was next for ridesharing in Austin? To find out we took a sample of approximately 3,000 tweets that included #Prop1 over the span of 10 days following the vote and searched for trends in the data.
Leading up to the vote (and after) a common theme was that the results in Austin would set a national precedent for cities to require fingerprinting. Although this was a vote over a local issue, it was covered by national media outlets including USA Today, Forbes, Huffington Post, The New York Times, and many more. #Prop1 tweets poured in from around the country, as shown in the map below.
more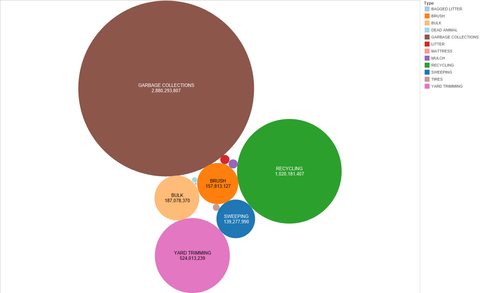
Earth Day Data Visualization of Austin Recycling
By Julia Schulze
The City of Austin website houses daily waste collection data dating all the way back to the end of 2004. With the city growing at such a rapid pace and the effort to be green at the front of our minds, we were curious what the data could tell us about these efforts. Do newcomers share Austin’s environmental vision? How has the amount of garbage and recycling changed over the past ten years? These are a couple of the questions we will be answering with data visualizations as we celebrate Earth Day.
Let’s start by looking at the past ten years as a whole. The waste is split into categories such as garbage collection, recycling, tires, yard trimmings, etc. Please note that we will be looking at recycling as a whole rather than splitting by stream to simplify the view.
more